Monitoring the performance and health of PHP applications is crucial for delivering a seamless user experience and ensuring optimal functionality. Open source monitoring tools offer cost-effective solutions for tracking various metrics, identifying issues, and optimizing PHP application performance. In this article, we’ll explore the top 5 open source PHP application monitoring tools that empower developers to gain insights into their applications.
1. Prometheus:
Prometheus is a widely used open source monitoring and alerting toolkit. It excels in collecting and querying metrics, making it suitable for monitoring PHP applications. Key features include a multi-dimensional data model, flexible query language, and support for dynamic service discovery.
Advantages:
- Highly scalable with a pull-based model.
- Powerful query language (PromQL) for in-depth analysis.
- Integrates well with Grafana for visualization.
Getting Started:
- Install Prometheus.
- Configure Prometheus to scrape metrics from your PHP application.
- Explore metrics using the Prometheus web UI or query them using PromQL.
2. Grafana:
Grafana is an open source analytics and monitoring platform that works seamlessly with various data sources, including Prometheus. While Grafana is primarily a visualization tool, its ability to integrate with multiple data sources makes it an essential companion to Prometheus for creating informative dashboards.
Advantages:
- Rich visualization options for creating detailed dashboards.
- Supports a wide range of data sources, including Prometheus.
- Allows for alerting and notification configurations.
Getting Started:
- Install Grafana.
- Add Prometheus as a data source.
- Create and customize dashboards with panels displaying PHP application metrics.
3. Tideways:
Tideways is an open source PHP performance monitoring and profiling tool. It offers insights into application performance, errors, and bottlenecks. Tideways supports transaction tracing, providing detailed information about the execution flow of PHP code.
Advantages:
- In-depth profiling for identifying performance bottlenecks.
- Real-time error tracking and reporting.
- Integrates with various PHP frameworks.
Getting Started:
- Install the Tideways extension on your PHP server.
- Configure your application to send data to the Tideways service.
- Explore performance insights and error tracking through the Tideways dashboard.
4. Netdata:
Netdata is an open source real-time monitoring and troubleshooting tool. It provides a comprehensive overview of system and application metrics, including PHP-FPM and web server statistics. Netdata’s visualizations help identify performance issues at a glance.
Advantages:
- Real-time monitoring with per-second granularity.
- Supports a wide range of integrations, including PHP-FPM.
- Lightweight and easy to install.
Getting Started:
- Install Netdata on your server.
- Access the Netdata dashboard to view real-time metrics.
- Customize and configure alerts based on your PHP application’s metrics.
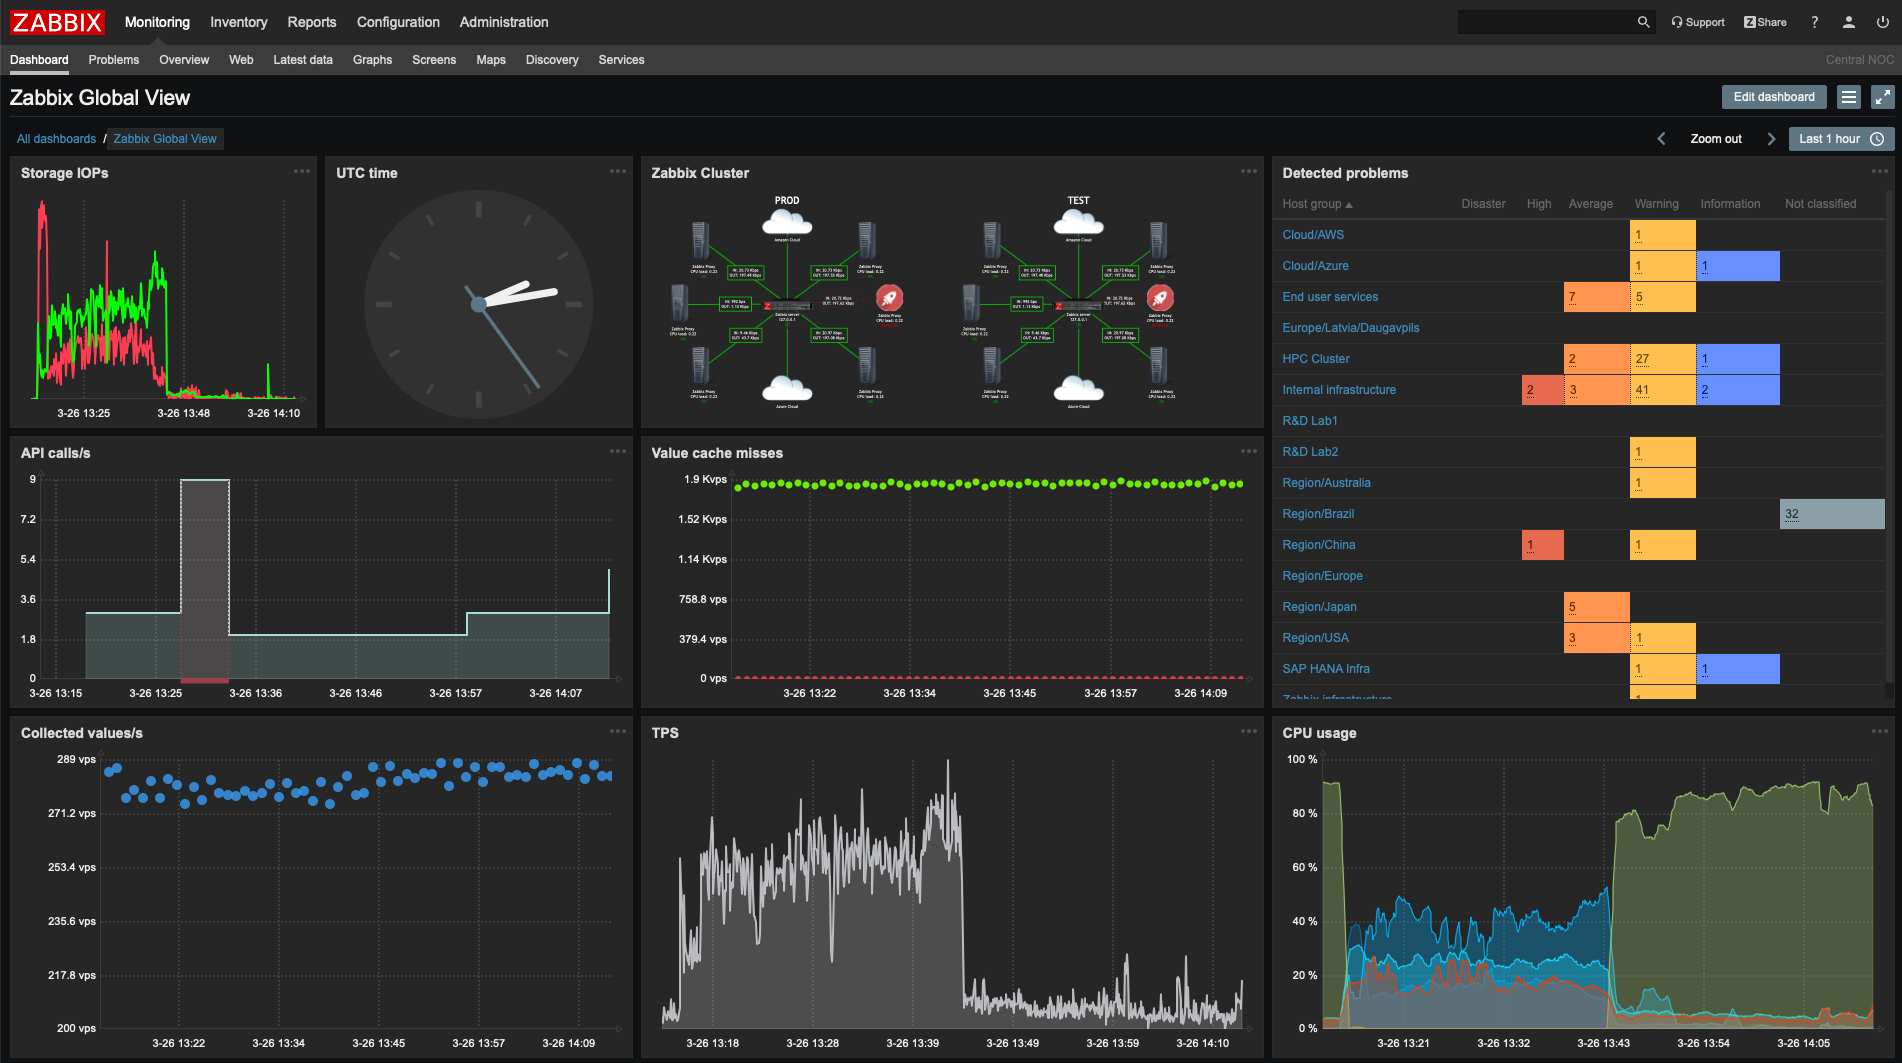
5. Zabbix:
Zabbix is an open source monitoring solution known for its versatility. While commonly used for server and network monitoring, Zabbix can be configured to monitor PHP applications by collecting metrics and generating alerts based on predefined thresholds.
Advantages:
- Extensive support for monitoring diverse environments.
- Customizable alerting and notification mechanisms.
- Web-based interface for configuring and visualizing monitored data.
Getting Started:
- Install and configure the Zabbix server.
- Set up a Zabbix agent on your PHP server to collect metrics.
- Create custom items, triggers, and dashboards for monitoring PHP application metrics.
Conclusion:
Open source PHP application monitoring tools empower developers to gain valuable insights into the performance, health, and behavior of their applications. Whether focusing on metrics collection, visualization, or profiling, these tools offer a range of features to meet the diverse monitoring needs of PHP developers. Choosing the right combination of tools based on your specific requirements can significantly enhance your ability to optimize and maintain the health of PHP applications.